Ambient profile#
In this tutorial, we’ll be walking through the steps to calculating the ambient profile.
In the first experiment, an equal number of human HEK293T cells and mouse NIH3T3 cells were pooled and sequenced, transcripts from the other organism were unambiguously ambient contamination. The original dataset is downloaded from 10x genomics dataset, and cell annotation file is available at scAR-reproducibility/data. We will be using two approaches to calculate the ambient profile.
In the second experiment, Gene Expression, Feature Barcode, BCR Enriched, and TCR Enriched libraries were generated from 16,520 human peripheral blood mononuclear cells (PBMCs) of a healthy male donor. We will be using the Feature Barcode data to demonstrate the calculation of ambient profile. For details, see 10x genomics dataset.
Note
To run this notebook on your device, you need to install .
Alternatively, you can also run this notebook on Colab ![]()
[ ]:
# Run this cell to install scar in Colab
# Skip this cell if running on your own device

%pip install scanpy
%pip install git+https://github.com/Novartis/scAR.git
%pip install matplotlib==3.1.3  # Specify this matplotlib version to avoid errors
[1]:
import pandas as pd
import matplotlib.pyplot as plt
import seaborn as sns
import scanpy as sc

import warnings
warnings.simplefilter("ignore")
mRNA ambient profile#
Download data#
The raw and filtered count matrices can be downloaded from 10x Dataset.
The raw data#
cellranger output: raw_feature_bc_matrix
[2]:
hgmm_20k_raw = sc.read_10x_h5(filename='20k_hgmm_3p_HT_nextgem_Chromium_X_raw_feature_bc_matrix.h5ad',
                                 backup_url='https://cf.10xgenomics.com/samples/cell-exp/6.1.0/20k_hgmm_3p_HT_nextgem_Chromium_X/20k_hgmm_3p_HT_nextgem_Chromium_X_raw_feature_bc_matrix.h5');
hgmm_20k_raw.var_names_make_unique();
The filtered data#
cellranger output: filtered_feature_bc_matrix
[3]:
hgmm_20k = sc.read_10x_h5(filename='20k_hgmm_3p_HT_nextgem_Chromium_X_filtered_feature_bc_matrix.h5ad',
                             backup_url='https://cf.10xgenomics.com/samples/cell-exp/6.1.0/20k_hgmm_3p_HT_nextgem_Chromium_X/20k_hgmm_3p_HT_nextgem_Chromium_X_filtered_feature_bc_matrix.h5');
hgmm_20k.var_names_make_unique();
Gene and cell filtering. Filter out genes of low coverage to save memory.
[4]:
sc.pp.filter_genes(hgmm_20k, min_counts=200);
sc.pp.filter_genes(hgmm_20k, max_counts=6000);
sc.pp.filter_cells(hgmm_20k, min_genes=200);
[5]:
hgmm_20k
[5]:
AnnData object with n_obs × n_vars = 16292 × 16586
    obs: 'n_genes'
    var: 'gene_ids', 'feature_types', 'genome', 'n_counts'
Estimate the ambient profile#
Option1, Calculate the ambient profile using the setup_anndata method#
Steps:
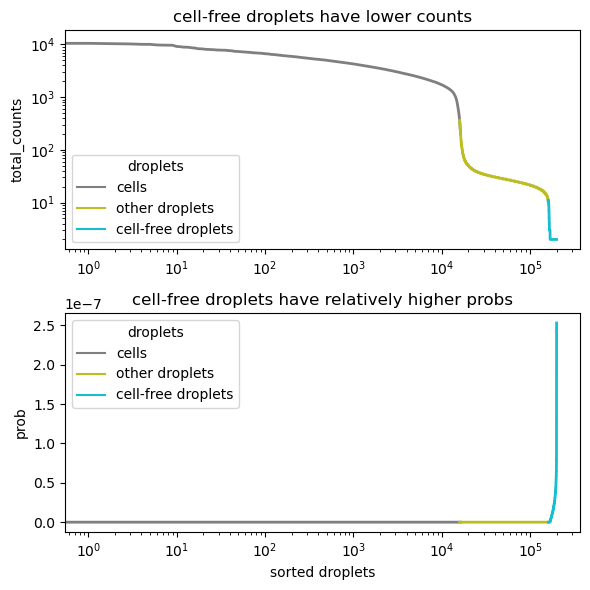
setup_anndata is inspired by EmptyDrops Lun2019, which assumes that cell-free droplets are sampled from a multinomial distribution.
It first calculates an initial ambient profile by averaging all droplets in raw_adata
It tested whether droplets fit the multinomial distribution (the ambient profile as the prob parameter). The relatively high probabilities suggest cell-free droplets
It re-calculates the ambient profile using the identified cell-free droplets
It repeats step 2 and step 3 for
iterationsThe final ambient profile is saved in
adata.uns
[6]:
from scar import setup_anndata

setup_anndata(
    adata = hgmm_20k,
    raw_adata = hgmm_20k_raw,
    prob = 0.995,
    kneeplot = True
)
2023-05-01 19:03:05|INFO|setup_anndata|Randomly sample 199666 droplets from 199666 droplets.
2023-05-01 19:03:05|INFO|setup_anndata|Estimating ambient profile for ['Gene Expression']...
2023-05-01 19:03:30|INFO|setup_anndata|Iteration: 1
2023-05-01 19:03:54|INFO|setup_anndata|Iteration: 2
2023-05-01 19:04:19|INFO|setup_anndata|Iteration: 3
2023-05-01 19:04:19|INFO|setup_anndata|Estimated ambient profile for Gene Expression saved in adata.uns
2023-05-01 19:04:19|INFO|setup_anndata|Estimated ambient profile for all features saved in adata.uns
[7]:
ambient_profile0 = hgmm_20k.uns["ambient_profile_Gene Expression"]
ambient_profile0.head()
[7]:
| ambient_profile_Gene Expression | |
|---|---|
| GRCh38_AL627309.5 | 0.000000 |
| GRCh38_LINC01128 | 0.000127 |
| GRCh38_LINC00115 | 0.000000 |
| GRCh38_FAM41C | 0.000010 |
| GRCh38_AL645608.2 | 0.000010 |
Option2, Calculate the ambient profile using a kneeplot#
Steps:
This option is based on total counts of droplets.
It first plots a kneeplot
It identifies subpopulations of droplets with arbitrary thresholds
It calculates the ambient profile from the subpopulation of ‘cell-free droplets’
[8]:
all_droplets = pd.DataFrame(hgmm_20k_raw.X.sum(axis=1), index = hgmm_20k_raw.obs_names, columns=['total_counts'])

all_droplets['droplets'] = 'cell-free droplets'
all_droplets['droplets'] = all_droplets['droplets'].mask(all_droplets['total_counts']>12, 'droplet II')
all_droplets['droplets'] = all_droplets['droplets'].mask(all_droplets['total_counts']>40, 'droplet I')
all_droplets['droplets'] = all_droplets['droplets'].mask(all_droplets.index.isin(hgmm_20k.obs_names), 'cells')
all_droplets = all_droplets.sort_values(by='total_counts', ascending=False).reset_index().rename_axis("rank").reset_index()
all_droplets = all_droplets.loc[all_droplets['total_counts']>0]
all_droplets = all_droplets.set_index('index').rename_axis('cells')
[9]:
plt.figure(figsize=(3, 2), dpi=150)

ax = sns.lineplot(data = all_droplets,
                  x='rank',
                  y='total_counts',
                  hue='droplets',
                  hue_order=['cells', 'droplet I', 'droplet II', 'cell-free droplets'],
                  palette=sns.color_palette()[-4:],
                  markers=False,
                  lw=2,
                  ci=None)

ax.set_xscale('log')
ax.set_yscale('log')
ax.set_xlabel('sorted droplets');
ax.legend(loc='lower left', ncol=1, title=None, frameon=False)
ax.set_title(f'kneeplot: 20k_hgmm')

sns.set_palette("muted")
sns.set_style("ticks")
sns.despine(offset=10, trim=False);

[10]:
cell_free = hgmm_20k_raw[hgmm_20k_raw.obs_names.isin(all_droplets[all_droplets['droplets']=='cell-free droplets'].index)]

cell_free = cell_free[:, hgmm_20k.var_names]

# average and normalize the transcript in cell-free droplets.
ambient_profile1 = pd.DataFrame((cell_free.X.sum(axis=0)/cell_free.X.sum()).A1, index = hgmm_20k.var_names, columns = ['ambient profile'])

ambient_profile1.head()
[10]:
| ambient profile | |
|---|---|
| GRCh38_AL627309.5 | 0.000006 |
| GRCh38_LINC01128 | 0.000086 |
| GRCh38_LINC00115 | 0.000015 |
| GRCh38_FAM41C | 0.000017 |
| GRCh38_AL645608.2 | 0.000015 |
Check that these two approaches generate consistent results
[11]:
from sklearn.metrics import r2_score

r2_score(ambient_profile0, ambient_profile1)
[11]:
0.7826796002453497
The ambient profile of feature barcodes#
Download data#
The raw and filtered count matrices can be downloaded from 10x Dataset.
The raw data#
cellranger output: raw_feature_bc_matrix
[12]:
PBMC_raw = sc.read_10x_h5(filename='sc5p_v2_hs_PBMC_10k_f_raw_feature_bc_matrix.h5ad',
                          gex_only=False,
                          backup_url='https://cf.10xgenomics.com/samples/cell-vdj/5.0.0/sc5p_v2_hs_PBMC_10k/sc5p_v2_hs_PBMC_10k_f_raw_feature_bc_matrix.h5');
PBMC_raw.var_names_make_unique();
The filtered data#
cellranger output: filtered_feature_bc_matrix
[13]:
PBMC_filtered = sc.read_10x_h5(filename='sc5p_v2_hs_PBMC_10k_f_filtered_feature_bc_matrix.h5ad',
                          gex_only=False,
                          backup_url='https://cf.10xgenomics.com/samples/cell-vdj/5.0.0/sc5p_v2_hs_PBMC_10k/sc5p_v2_hs_PBMC_10k_f_filtered_feature_bc_matrix.h5');
PBMC_filtered.var_names_make_unique();
[14]:
PBMC_filtered
[14]:
AnnData object with n_obs × n_vars = 12773 × 19
    var: 'gene_ids', 'feature_types', 'genome'
[15]:
PBMC_raw
[15]:
AnnData object with n_obs × n_vars = 737280 × 19
    var: 'gene_ids', 'feature_types', 'genome'
Estimate the ambient profile#
[16]:
from scar import setup_anndata

setup_anndata(
    adata = PBMC_filtered,
    raw_adata = PBMC_raw,
    prob = 0.7, # try a lower prob value when error ocurs
    min_raw_counts=2,
    kneeplot = True
)
2023-05-01 19:04:39|INFO|setup_anndata|Randomly sample 515704 droplets from 515704 droplets.
2023-05-01 19:04:39|INFO|setup_anndata|Estimating ambient profile for ['Antibody Capture']...
2023-05-01 19:04:40|INFO|setup_anndata|Iteration: 1
2023-05-01 19:04:41|INFO|setup_anndata|Iteration: 2
2023-05-01 19:04:41|INFO|setup_anndata|Iteration: 3
2023-05-01 19:04:41|INFO|setup_anndata|Estimated ambient profile for Antibody Capture saved in adata.uns
2023-05-01 19:04:41|INFO|setup_anndata|Estimated ambient profile for all features saved in adata.uns

[17]:
PBMC_filtered.uns["ambient_profile_Antibody Capture"]
[17]:
| ambient_profile_Antibody Capture | |
|---|---|
| CD3_TotalC | 0.074758 |
| CD19_TotalC | 0.029752 |
| CD45RA_TotalC | 0.140524 |
| CD4_TotalC | 0.126031 |
| CD8a_TotalC | 0.066558 |
| CD14_TotalC | 0.037047 |
| CD16_TotalC | 0.007975 |
| CD56_TotalC | 0.013442 |
| CD25_TotalC | 0.089229 |
| CD45RO_TotalC | 0.026414 |
| PD-1_TotalC | 0.025025 |
| TIGIT_TotalC | 0.011173 |
| IgG1_TotalC | 0.041307 |
| IgG2a_TotalC | 0.057658 |
| IgG2b_TotalC | 0.000000 |
| CD127_TotalC | 0.012793 |
| CD15_TotalC | 0.110497 |
| CD197_TotalC | 0.030448 |
| HLA-DR_TotalC | 0.099369 |