sgRNA assignment#
In this tutorial, we’ll be walking through the steps to sgRNA assignment for scCRISPRseq (inc. CROP-seq, Perturb-seq, CRISP-seq) as well as assignment of cell tags for multiplexed indexing experiments.
In this experiment, A549 lung carcinoma cells were transduced with a pool containing 93 total sgRNAs (90 sgRNAs targeting 45 different genes and 3 control sgRNAs). Cells were split into 6 conditions, receiving no treatment or treatments of DZNep, Trichostatin A, Valproic Acid, Kinetin, or, Resveratrol. Before sequencing, cells were multiplexed at equal proportions with 1 CMO per sample type. The original dataset is downloaded from 10x genomics dataset.
Note
To run this notebook on your device, you need to install .
Alternatively, you can also run this notebook on Colab ![]()
[ ]:
# Run this cell to install scar in Colab
# Skip this cell if running on your own device

%pip install scanpy
%pip install git+https://github.com/Novartis/scAR.git
%pip install matplotlib==3.1.3  # Specify this matplotlib version to avoid errors
[1]:
import pandas as pd
import matplotlib.pyplot as plt
import seaborn as sns
import scanpy as sc
from scar import model

import warnings
warnings.simplefilter("ignore")
Download data#
The raw count matrices (cellranger output: raw_feature_bc_matrix) can be downloaded from 10x Dataset. Filtered count matrices are not available for this experiment.
[2]:
A549_30K = sc.read_10x_h5(filename='CRISPR_A549_30K_Multiplex_count_raw_feature_bc_matrix.h5ad',
                          gex_only=False,
                          backup_url='https://cf.10xgenomics.com/samples/cell-exp/6.0.0/SC3_v3_NextGem_DI_CellPlex_CRISPR_A549_30K_Multiplex/SC3_v3_NextGem_DI_CellPlex_CRISPR_A549_30K_Multiplex_count_raw_feature_bc_matrix.h5');

A549_30K.var_names_make_unique();
sgRNA counts (unfiltered droplets)
[3]:
A549_30K_sgRNA_raw = A549_30K[:, A549_30K.var['feature_types']=='CRISPR Guide Capture'].to_df()
Estimate ambient profile#
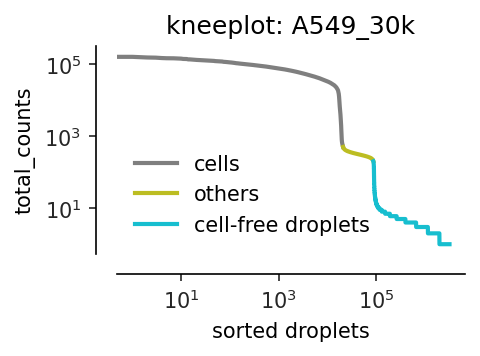
Identify cell-containing and cell-free droplets using kneeplot of mRNA counts.
Note
An alternative is to calculate ambient profile with setup_anndata method. See an example in calculating ambient profile.
[4]:
all_droplets = pd.DataFrame(A549_30K[:,A549_30K.var['feature_types']=='Gene Expression'].X.sum(axis=1), index = A549_30K.obs_names, columns=['total_counts'])

all_droplets['droplets'] = 'cell-free droplets'
all_droplets['droplets'] = all_droplets['droplets'].mask(all_droplets['total_counts']>200, 'others')
all_droplets['droplets'] = all_droplets['droplets'].mask(all_droplets['total_counts']>500, 'cells')
all_droplets = all_droplets.sort_values(by='total_counts', ascending=False).reset_index().rename_axis("rank").reset_index()
all_droplets = all_droplets.loc[all_droplets['total_counts']>0]
all_droplets = all_droplets.set_index('index').rename_axis('cells')
The thresholds (200 and 500) are experiment-specific. We currently manually determine them by examing the following kneeplot.
[5]:
plt.figure(figsize=(3, 1.8), dpi=150)

ax = sns.lineplot(data = all_droplets,
                  x='rank',
                  y='total_counts',
                  hue='droplets',
                  hue_order=['cells', 'others', 'cell-free droplets'],
                  palette=sns.color_palette()[-3:],
                  markers=False,
                  lw=2,
                  ci=None)

ax.set_xscale('log')
ax.set_yscale('log')
ax.set_xlabel('sorted droplets');
ax.legend(loc='lower left', ncol=1, title=None, frameon=False)
ax.set_title(f'kneeplot: A549_30k');

sns.set_palette("muted")
sns.set_style("ticks")
sns.despine(offset=10, trim=False);
Raw count matrix of sgRNAs (filtered droplets)
[6]:
A549_30K_filtered = A549_30K[A549_30K.obs_names.isin(all_droplets[all_droplets['droplets']=='cells'].index)] # equal to filtered population as cellranger output
[7]:
A549_30K_sgRNAs_filtered = A549_30K_filtered[:, A549_30K_filtered.var['feature_types']=='CRISPR Guide Capture'].to_df() # pandas.DataFrame

A549_30K_sgRNAs_filtered.head()
[7]:
| Non-Targeting-5 | Non-Targeting-7 | Non-Targeting-8 | APH1A-1 | APH1A-2 | CDKN3-1 | CDKN3-2 | EZR-1 | EZR-2 | GRB2-1 | ... | ACE2-1 | ACE2-2 | TMPRSS2-1 | TMPRSS2-2 | RAB1A-2 | RAB1A-3 | DPP4-1 | DPP4-2 | HDAC1-1 | HDAC1-2 | |
|---|---|---|---|---|---|---|---|---|---|---|---|---|---|---|---|---|---|---|---|---|---|
| AAACCCAAGCTAAGTA-1 | 0.0 | 5.0 | 0.0 | 180.0 | 0.0 | 0.0 | 0.0 | 0.0 | 0.0 | 0.0 | ... | 0.0 | 0.0 | 1.0 | 0.0 | 0.0 | 0.0 | 1.0 | 0.0 | 0.0 | 2.0 |
| AAACCCAAGGAAGTGA-1 | 0.0 | 1.0 | 2.0 | 0.0 | 0.0 | 0.0 | 0.0 | 0.0 | 0.0 | 0.0 | ... | 0.0 | 0.0 | 3.0 | 0.0 | 0.0 | 0.0 | 0.0 | 0.0 | 0.0 | 0.0 |
| AAACCCAAGGTTGGAC-1 | 0.0 | 0.0 | 0.0 | 0.0 | 0.0 | 0.0 | 0.0 | 0.0 | 0.0 | 0.0 | ... | 2.0 | 0.0 | 0.0 | 0.0 | 0.0 | 0.0 | 0.0 | 0.0 | 0.0 | 0.0 |
| AAACCCAAGTGCGTCC-1 | 1.0 | 0.0 | 5.0 | 0.0 | 0.0 | 4.0 | 1.0 | 0.0 | 1.0 | 0.0 | ... | 0.0 | 3.0 | 0.0 | 0.0 | 0.0 | 0.0 | 0.0 | 0.0 | 0.0 | 0.0 |
| AAACCCAAGTGCTCGC-1 | 2.0 | 0.0 | 0.0 | 0.0 | 0.0 | 0.0 | 1.0 | 0.0 | 0.0 | 0.0 | ... | 0.0 | 0.0 | 0.0 | 0.0 | 0.0 | 0.0 | 0.0 | 0.0 | 0.0 | 0.0 |
5 rows × 93 columns
Ambient profile of sgRNAs
[8]:
cell_free_sgRNAs = A549_30K_sgRNA_raw.loc[A549_30K_sgRNA_raw.index.difference(A549_30K_sgRNAs_filtered.index)]
ambient_profile_sgRNAs = cell_free_sgRNAs.sum()/cell_free_sgRNAs.sum().sum()   # pandas.Series
ambient_profile_sgRNAs = ambient_profile_sgRNAs.to_frame("ambient profile")

ambient_profile_sgRNAs.head()
[8]:
| ambient profile | |
|---|---|
| Non-Targeting-5 | 0.022609 |
| Non-Targeting-7 | 0.026718 |
| Non-Targeting-8 | 0.035229 |
| APH1A-1 | 0.022778 |
| APH1A-2 | 0.003036 |
Training#
[9]:
sgRNAs = model(raw_count = A549_30K_sgRNAs_filtered,
               ambient_profile = ambient_profile_sgRNAs, # In the case of default None, the ambient_profile will be calculated by averaging pooled cells
               feature_type = 'sgRNAs')

sgRNAs.train(epochs=100,
             batch_size=64,
             verbose=True
            )

# After training, we can infer the native true signal
sgRNAs.inference(cutoff=3)  # by defaut, batch_size=None, set a batch_size if getting a GPU memory issue
2024-08-10 21:02:55|INFO|model|cuda is detected and will be used.
2024-08-10 21:02:55|INFO|VAE|Running VAE using the following param set:
2024-08-10 21:02:55|INFO|VAE|...denoised count type: sgRNAs
2024-08-10 21:02:55|INFO|VAE|...count model: binomial
2024-08-10 21:02:55|INFO|VAE|...num_input_feature: 93
2024-08-10 21:02:55|INFO|VAE|...NN_layer1: 150
2024-08-10 21:02:55|INFO|VAE|...NN_layer2: 100
2024-08-10 21:02:55|INFO|VAE|...latent_space: 15
2024-08-10 21:02:55|INFO|VAE|...dropout_prob: 0.00
2024-08-10 21:02:55|INFO|VAE|...expected data sparsity: 1.00
2024-08-10 21:02:55|INFO|model|kld_weight: 1.00e-05
2024-08-10 21:02:55|INFO|model|learning rate: 1.00e-03
2024-08-10 21:02:55|INFO|model|lr_step_size: 5
2024-08-10 21:02:55|INFO|model|lr_gamma: 0.97
Training: 100%|██████████| 100/100 [02:55<00:00, 1.76s/it, Loss=4.2189e+02]
Resulting assignment is saved in sgRNAs.feature_assignment.
If there are multiple guides detected after denoising, try to increase the cutoff and re-run sgRNAs.inference(cutoff=10)
[10]:
sgRNAs.feature_assignment
[10]:
| sgRNAs | n_sgRNAs | |
|---|---|---|
| AAACCCAAGCTAAGTA-1 | APH1A-1, H2AFY-1 | 2 |
| AAACCCAAGGAAGTGA-1 | PPIB-2 | 1 |
| AAACCCAAGGTTGGAC-1 | GSK3A-1, ACE2-1 | 2 |
| AAACCCAAGTGCGTCC-1 | H2AFY-2, ACE2-2 | 2 |
| AAACCCAAGTGCTCGC-1 | CTCF-2 | 1 |
| ... | ... | ... |
| TTTGTTGTCCCATTTA-1 | CSNK2A1-1 | 1 |
| TTTGTTGTCGGAACTT-1 | EIF4EBP1-2 | 1 |
| TTTGTTGTCGGCTGTG-1 | SUZ12-1 | 1 |
| TTTGTTGTCTGGGCGT-1 | GSK3A-2 | 1 |
| TTTGTTGTCTTCCAGC-1 | PPIB-2, RBBP4-1 | 2 |
21091 rows × 2 columns
Visulization#
Plot setting
[11]:
from matplotlib import pylab

params = {'legend.fontsize': 6,
          'legend.title_fontsize': 8,
          'figure.facecolor':"w",
          'figure.figsize': (4, 3),
         'axes.labelsize': 10,
         'axes.titlesize':10,
         'axes.linewidth': 0.5,
         'xtick.labelsize':10,
         'ytick.labelsize':10,
         'axes.grid':False,}

pylab.rc('font',**{'family':'serif','serif':['Palatino'],'size':10})
pylab.rcParams.update(params);

sns.set_palette("muted");
sns.set_style("ticks");
sns.despine(offset=4, trim=True);
<Figure size 400x300 with 0 Axes>
Cell number of sgRNA assignments#
[12]:
cell_num = sgRNAs.feature_assignment.value_counts("n_sgRNAs").to_frame("cell numbers").reset_index()

plt.figure(figsize=(4, 3))

sns.barplot(data = cell_num,
            x = 'n_sgRNAs',
            y = 'cell numbers'
           );

plt.xlabel("number of distinct sgRNAs");
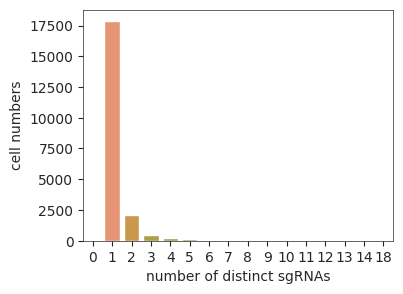
Most of cells are assigned with a single sgRNA.